Reporting Tools
Real time volunteer data and statistics give you quick access to complete and view visual figures for annual and instantaneous reports for grant applications. Organized by departments within your organization and also specific programs of focus.
Analyze number of new volunteers signed up
VolunteerMark gives you the power of information to analyze how many volunteers have signed up each month for VolunteerMark. This recorded data allows you to visualize the results of marketing moves and program campaigns giving you significant analytical power
Lets say that you started a twitter account and your volunteer sign ups jumped from 3 new during the month of May to 13 new in June. This would suggest strong correlation that your twitter campaign has sparked an increase in new volunteers.

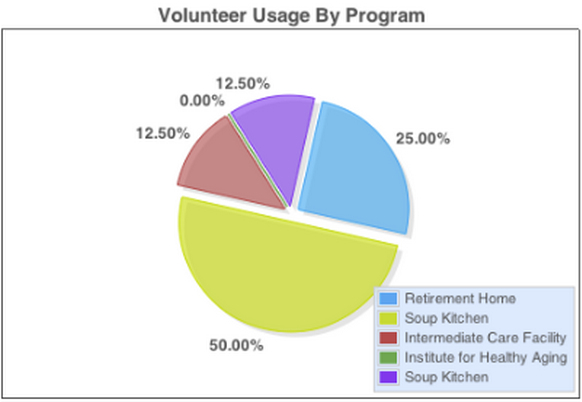
Analyze volunteer usage by program
At this point, you have progressed in your organization profile creation, and completing various programs. you can now analyze the activity of your programs in comparison to one another.
This reporting data allows you to keep track of the total volunteer hours designated to each program that you have created. Helping you see what programs are sources of strength in your organization and what programs need some extra attention, allowing nothing to go on unaddressed.

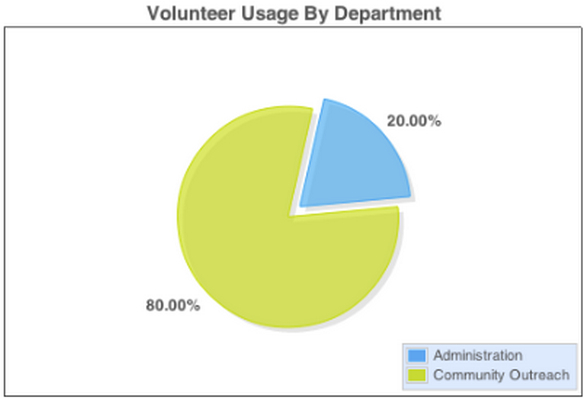
Analyze volunteer usage by department
Now that you have progressed in your organization profile creation, completing various departments, you can now analyze the activity of your programs in comparison to one another.
This reporting data allows you to keep track of the total volunteer hours designated to each department that you have created. Helping you see what departments are sources of strength in your organization and what programs need some extra attention, allowing nothing to go on unaddressed.
